Achieving Batch-to-Batch Consistency with Antibody Oligonucleotide Conjugates (AOCs)
Key takeaways
- Batch-to-batch consistency in antibody conjugate production can only be achieved with tight control of multiple reaction parameters, and holding a single target degree of labeling (DoL) across batches is far harder than varying it within one experiment.
- In a study of 10 AOCs made across three days at 20µg scale, intra-day coefficient of variation (CV%) stayed below 3.5% on every day.
- Across all three days the pooled CV% for the 10 conjugates was 7.53%, even though both the antibody and the oligo were deliberately changed mid-study.
- AbOliGo's production processes deliver AOCs within a narrow DoL target range with low CV%, supporting reliable, reproducible conjugate supply.
Batch-to-batch consistency in antibody conjugate production is challenging with any type of label and can only be achieved with tight control of multiple reaction parameters. While the degree of labeling (DoL) for an antibody-oligo conjugate (AOC) can easily be varied within an experiment to provide a range of conjugates for evaluation, it is far more challenging to maintain a single target DoL value across multiple batches. At AbOliGo, we are developing new conjugation methodologies to achieve consistent outcomes for AOCs.
Fig 1 shows a typical reducing SDS gel result when varying the DoL (increasing left to right) in the production of some trial AOCs. Such an experiment might be done with a new antibody or a new oligo to find the reaction conditions yielding the best conjugate for a particular application.
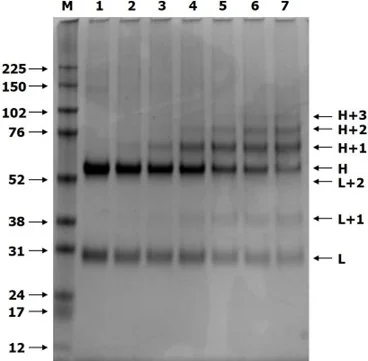
Figure 1. Coomassie-stained reducing SDS-gel of IgG and six AOCs
Unmodified heavy (H) and light chains (L) for control IgG can be seen in track 1, with marker proteins (M) shown on the left. Across tracks 2 to 7, the incorporation of oligo into the antibody increases, and there is a concomitant loss of H and L staining. Chains modified with one oligo (H+1 or L+1) become more pronounced, and H+2 and even H+3 bands are seen at very high levels of modification.
After purification of AOCs and further evaluation in an application, it is possible to correlate assay performance with the DoL and then select a preferred target DoL value for future production runs. At AbOliGo, we have examined the consistency of production of AOCs using our latest process.
Batch Consistency Study
Table 1 below shows data for three conjugation experiments (A, B, C) carried out on different days at 20µg scale. A batch changeover for both the antibody and oligo was introduced during the study to provide some additional challenges to minimize variation. DoL was determined by a proprietary algorithm.
Key Results
- •Intra-day coefficient of variation (CV%) was below 3.5% for all three days
- •For the pooled data across three days (10 conjugates) the coefficient was 7.53%
Table 1. Analysis of AOC variation
| Experiment A | DoL |
|---|---|
| Conjugate 1 | 2.73 |
| Conjugate 2 | 2.61 |
| Conjugate 3 | 2.66 |
| Conjugate 4 | 2.78 |
| Average | 2.695 |
| STD.S | 0.075 |
| CV% | 2.78 |
| Experiment B | DoL |
|---|---|
| Conjugate 5 | 2.42 |
| Conjugate 6 | 2.46 |
| Conjugate 7 | 2.57 |
| Average | 2.483 |
| STD.S | 0.078 |
| CV% | 3.13 |
| Experiment C | DoL |
|---|---|
| Conjugate 8 | 2.32 |
| Conjugate 9 | 2.23 |
| Conjugate 10 | 2.24 |
| Average | 2.263 |
| STD.S | 0.049 |
| CV% | 2.18 |
| Global Statistics | Value |
|---|---|
| Global Average | 2.502 |
| Global STD.P | 0.188 |
| Global CV% | 7.53 |
Conclusion
Despite the technical challenges of producing consistent batches of AOCs, we demonstrate here that even with deliberate changes of the input materials, AbOliGo's production processes deliver AOCs within a narrow DoL target range, with low CV% values.
Performance Summary
Experience consistent, high-quality AOC production
AbOliGo Custom Services